
Branded vs. Non-Brand Google Ads: A Roofing Benchmark Analysis (January-June 2026)
We analyzed $717K in Google Ads spend across 28 roofing contractors to benchmark branded and non-brand search campaigns.

👋 Hey, Jon here!
This issue offers a deeper look into Google Ads performance among roofers, specifically examining the performance of branded and unbranded campaigns separately.
Branded campaigns target users searching for your company or brand name, typically to protect your own backyard if competitors are bidding on your name.
Unbranded campaigns target more general terms like ‘roofers near me’ in an attempt to capture demand from customers who need your services but aren’t yet searching for a specific brand.
In our HVAC/plumbing focused newsletter we found pretty large discrepancies in performance between the two types.
Looking at just a blended return on ad spend for Google Ads doesn’t tell the full story, and I go into detail below.
A note on this data:
This analysis covers 28 roofing contractors on the SearchLight platform from January 1 through June 12, 2026, using campaign-level Google Ads data. Total spend tracked across the period was $717,644.
Campaigns were classified as Brand or Non-Brand Search based on campaign naming conventions -- Brand campaigns identified by “brand” or “branded” in the campaign name; all other search campaigns classified as Non-Brand Search. PMAX campaigns were excluded due to small sample size (5 accounts, 1.1% of spend).
June data covers the first 12 days of the month only and is noted as such throughout.
PS - If you’re getting value from these articles, I would love for you to consider sharing this newsletter with a colleague and your network: RoofingData.Substack.com
And, if you’re interested in tracking this data for your own business, set up a time with us here!
With that, let’s get into the data!
How Roofing Contractors Are Splitting Their Google Ads Budget
The median roofing contractor in this sample put 33.9% of their Google Ads budget toward branded campaigns and 66.1% toward non-brand (unbranded) search.
The split across accounts is nearly even: 12 of 28 accounts allocate more than 50% to brand. 11 of 28 allocate less than 20% to brand.
While this is a smaller sample, we typically see HVAC/Plumbing companies put 10% or less of their Google Ads budget into Branded campaigns, but for roofing contractors, we’re seeing a higher allocation.
Full-Period Performance: Volume Metrics
Across all 28 accounts, January 1 through June 12, 2026:
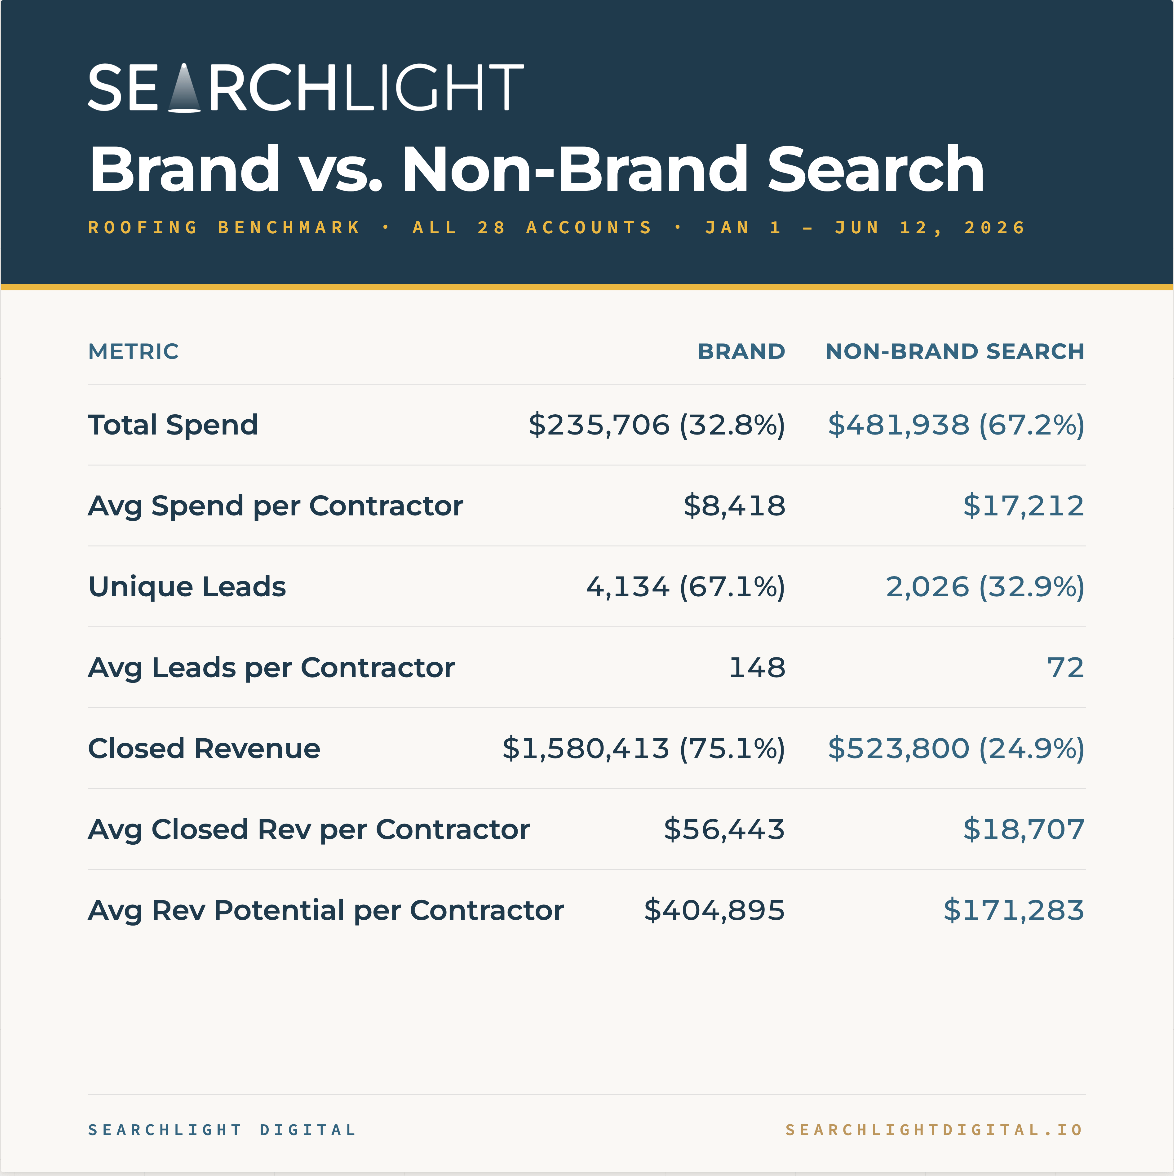
Brand campaigns generated 67% of all unique leads on 33% of spend, and 75% of all closed revenue across the six-month window.
Just because branded campaigns converted 75% of all closed revenue does not mean those customers were existing or would’ve converted regardless of whether a paid ad was shown during their search.
This is useful information because if unbranded campaigns aren’t producing volume or ROAS, that budget may in fact be better spent on branded with some allocation to alternative marketing strategies (other channels included).
Full-Period Performance: Efficiency Metrics
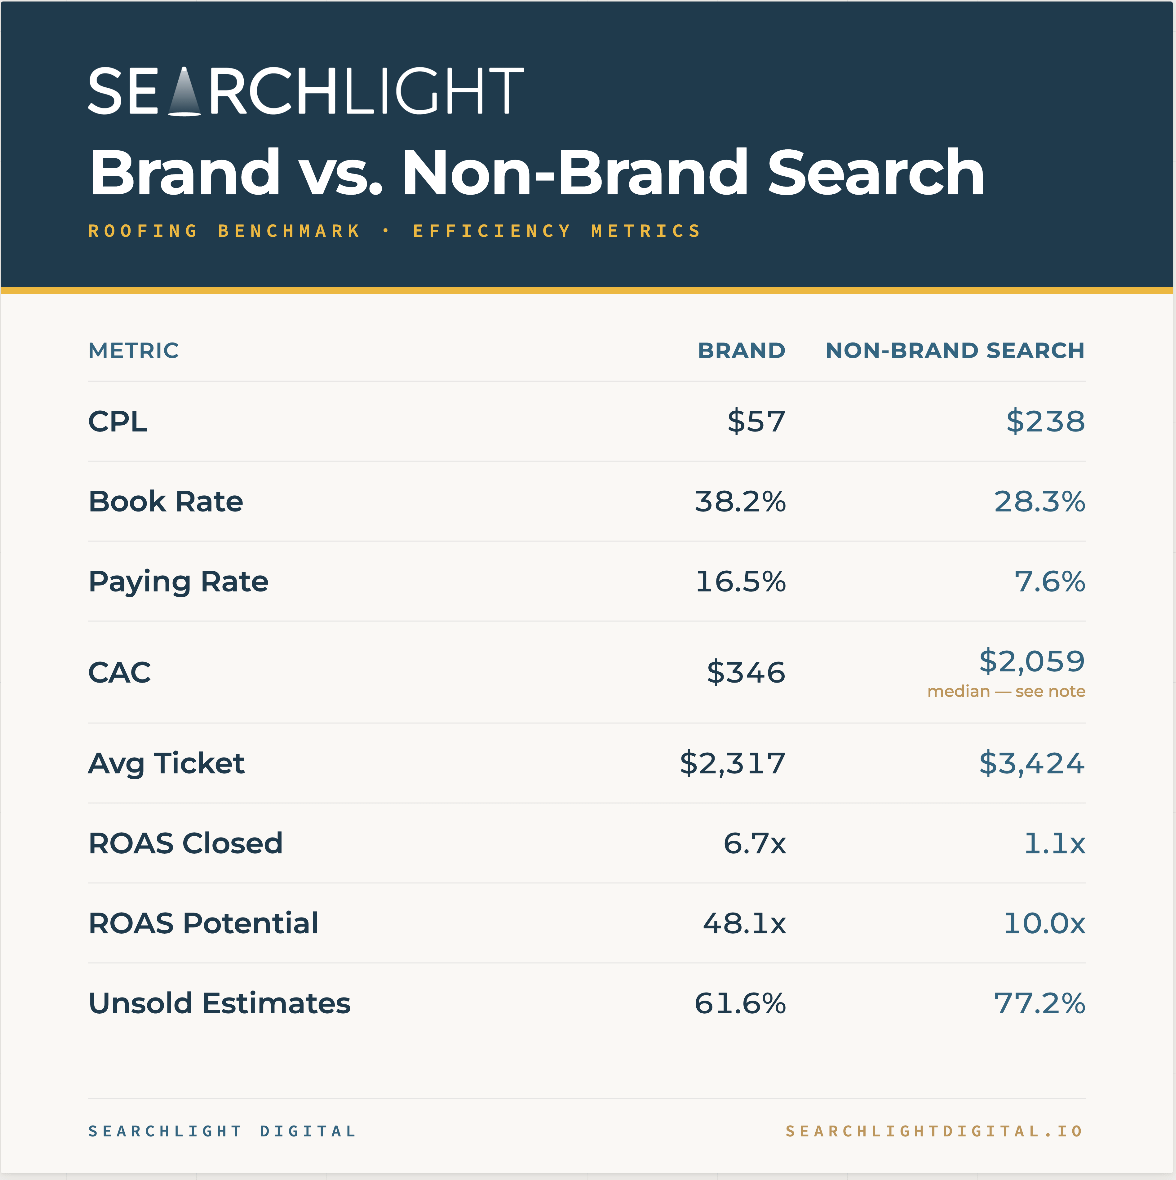
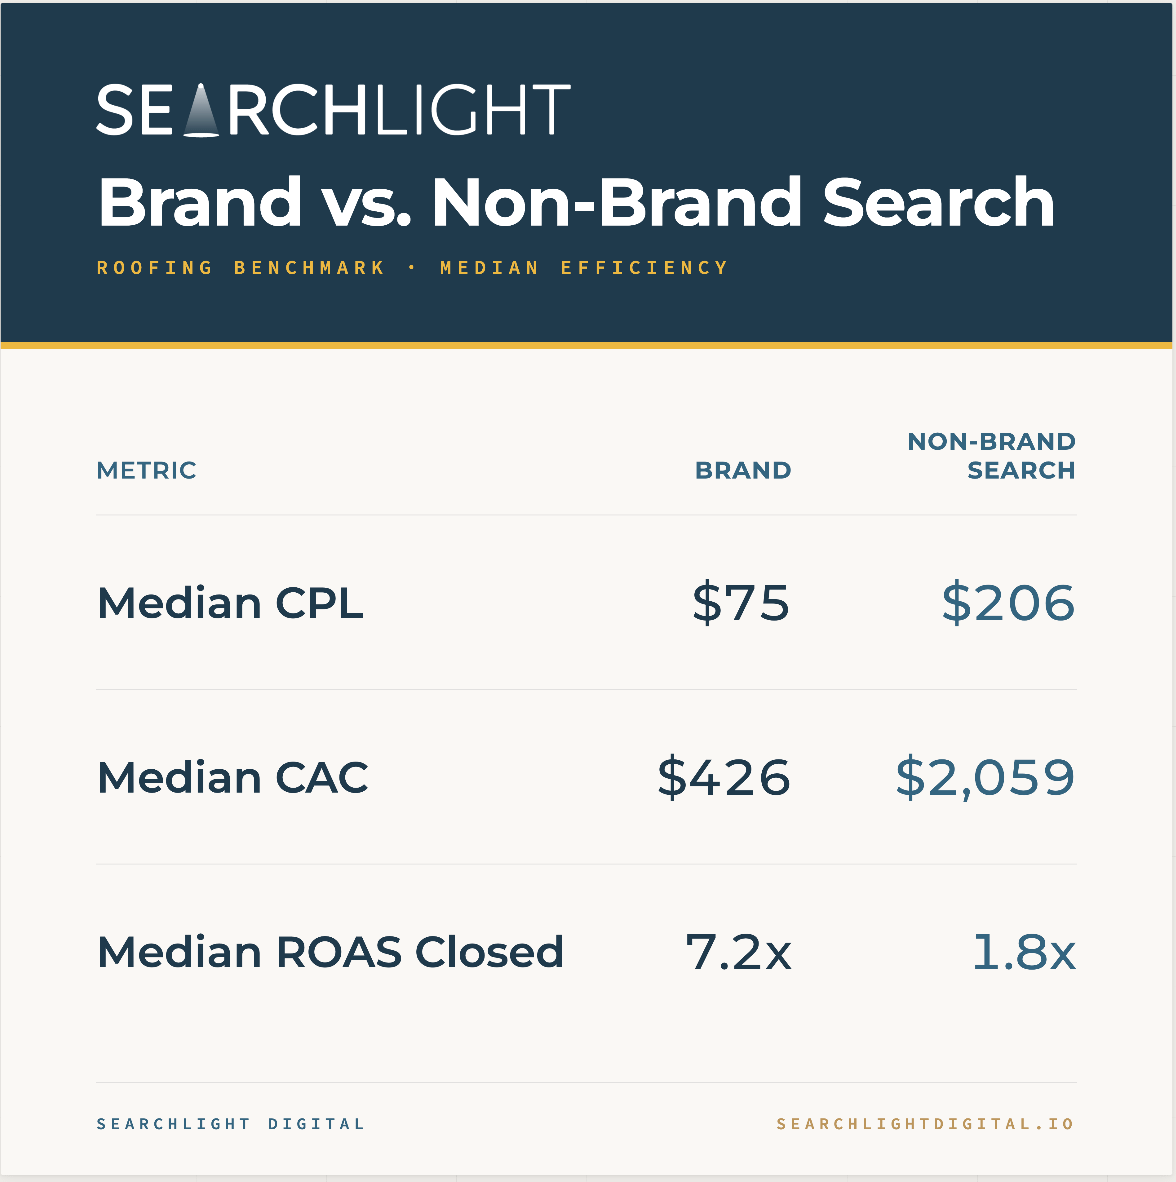
Per-account medians (reduces impact of outliers):
A note on non-brand search CAC (customer acquisition cost): The aggregate CAC across all 28 accounts is $3,150, but we’ve used the median ($2,059) as the more representative benchmark for two reasons. First, several accounts in the sample show $0 paying customers from non-brand search despite meaningful spend -- not because the channel isn’t working, but because roofing jobs sold in recent months haven’t yet closed and collected in the platform. Second, one account with $70K in non-brand search spend and only 2 paying customers recorded is pulling the aggregate up significantly. The median across the 17 accounts with at least one paying customer ($2,059) is the more useful calibration point.
Roofing CACs on Google Ads are higher than what we’ve seen in HVAC/Plumbing - depending on your average tickets, the investment can be worth it, but it’s even more costly if high-intent customers fall through the cracks during your sales funnel or if you aren’t watching unbranded campaign performance to make sure they’re giving you at-bats.
Google Ads can get expensive (and unprofitable) quickly without those checks in place as suggested by this data.
Monthly Trend: Spend Allocation
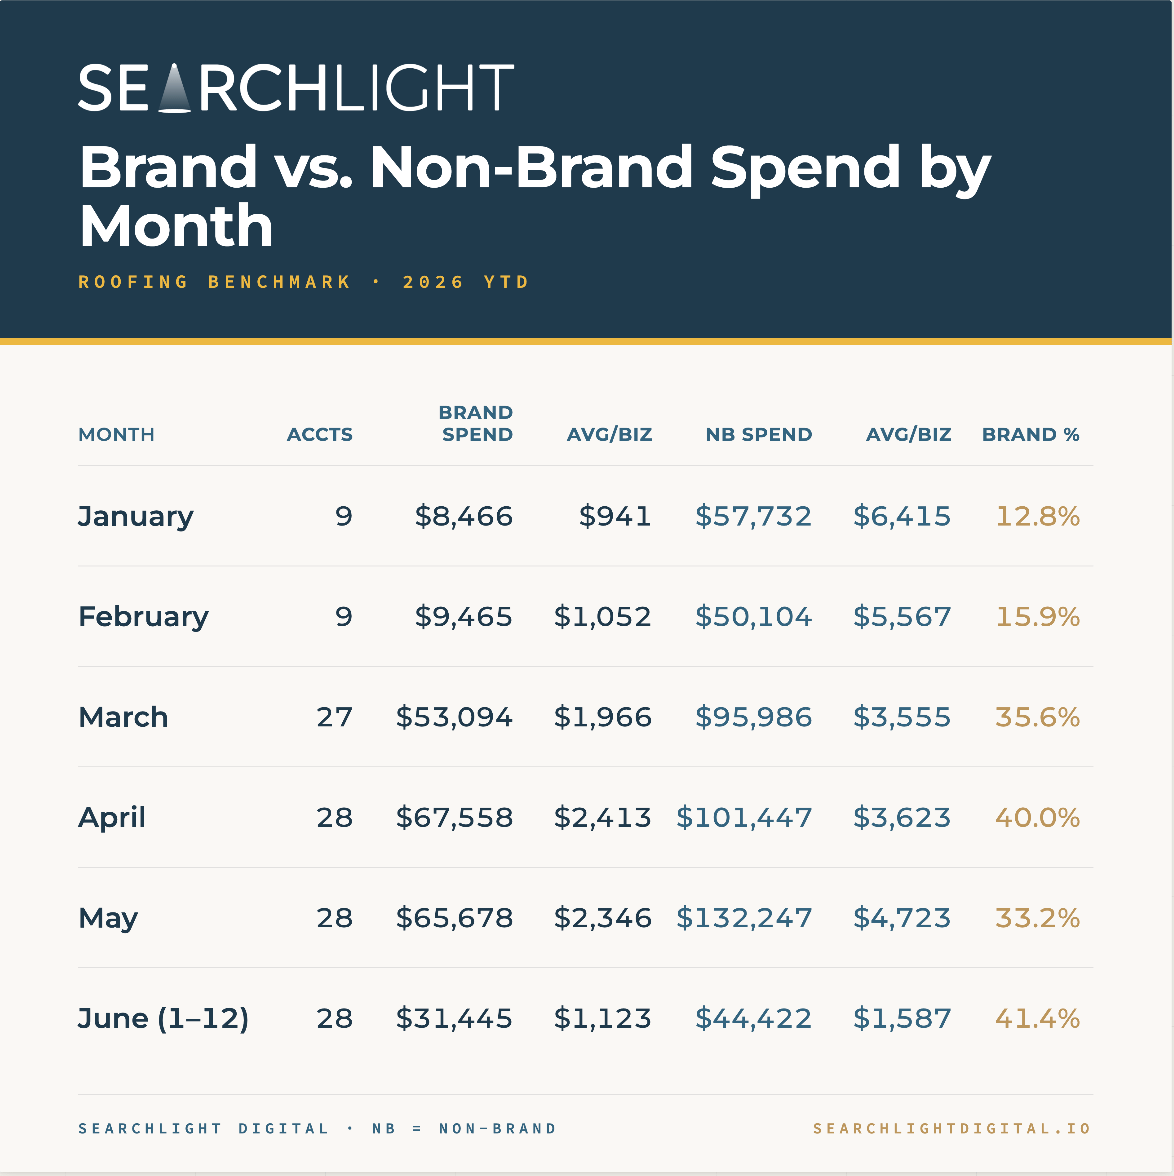
Brand allocation was at its lowest in January and February (13-16%), but climbed as peak season arrived in March and April, dipped in May as non-brand search spend hit its highest point of the year ($4,723 avg per contractor), and is back up to 41.4% through the first 12 days of June -- the highest point in the dataset.
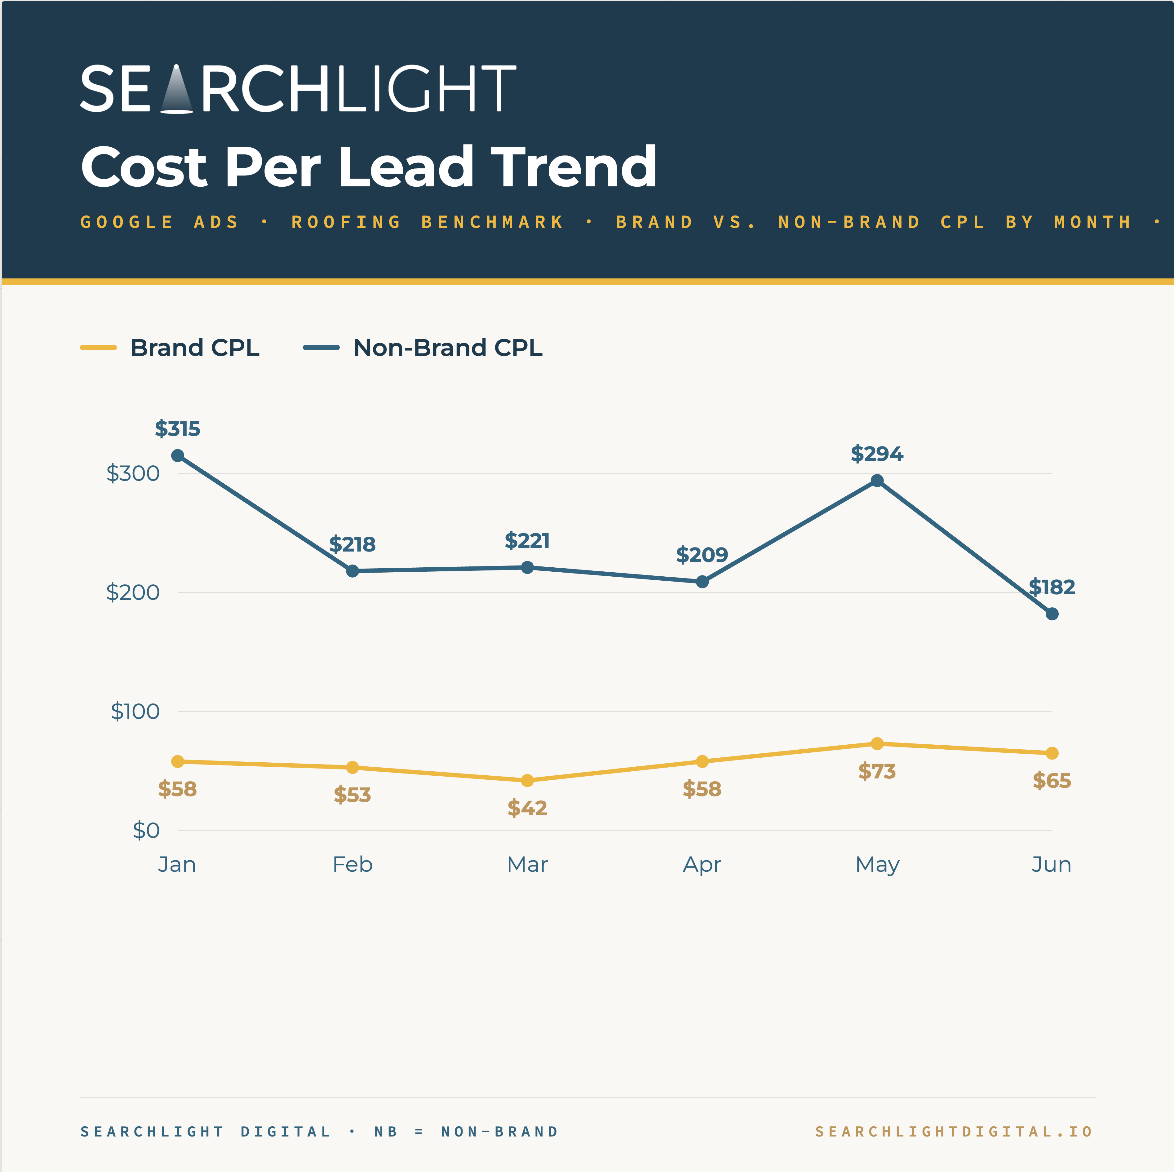
Monthly Trend: Efficiency
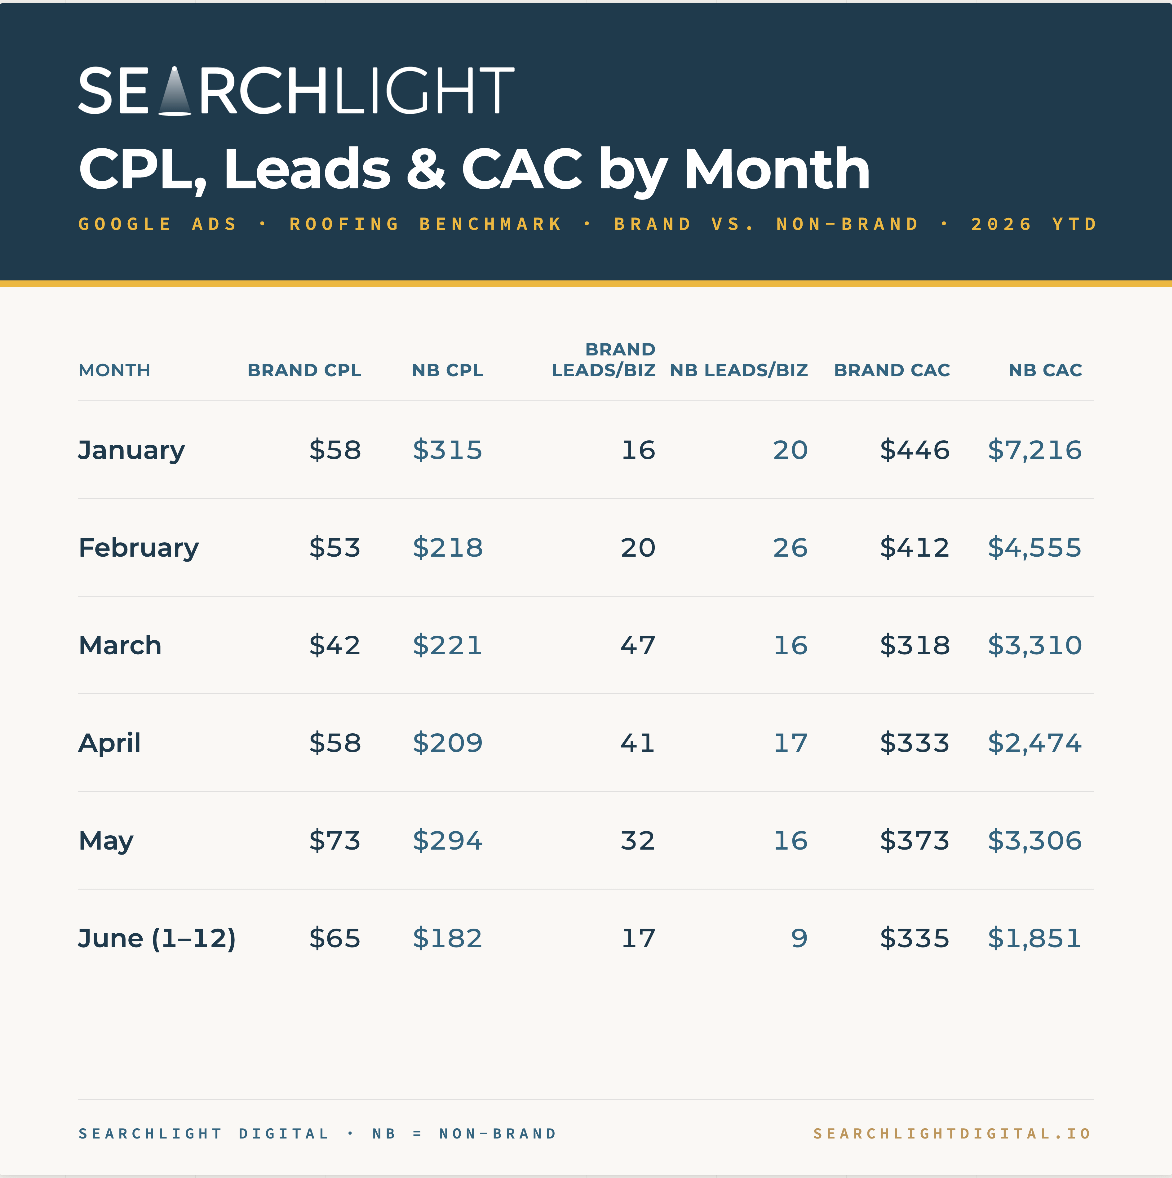
Brand CPL is stable across the season -- staying in a $42-$73 range across all six periods. Non-brand search swings from $182 to $315 and is more expensive than brand in every single month.
Brand generates significantly more leads per contractor per dollar. In March, brand produced an average of 47 leads per contractor on $1,966 in avg spend. Non-brand search produced 16 leads per contractor on $3,555.
If you are getting leads from non-brand on Google Ads, make sure they’re converting by checking book rate, match rate, paying customer rate and nurturing those customers throughout the sales process because they are expensive!
In January, non-brand search CAC was $7,216 -- more than 16x the brand CAC of $446. In February, non-brand search CAC was $4,555 vs. $412 for brand. Roofing contractors running heavy non-brand search in winter are paying a steep premium based on this data.
June (through the 12th) is showing early signs of improved efficiency across both campaign types. Non-brand search CAC is at its lowest point in the dataset at $1,851, while brand CAC ($335) is tracking in line with April and May.
What to Take From This
This analysis is descriptive, not prescriptive: the right brand vs. non-brand allocation depends on your market, your brand awareness, your growth goals, and your agency’s strategy.
But the benchmarks above give you a calibration point.
A few questions worth asking against your own numbers:
How does your brand CPL compare to the $75 median? Significantly higher suggests either campaign structure issues or lower brand awareness in your market.
How does your non-brand search CAC compare to the $2,059 median? Significantly higher suggests targeting, landing page, or lead handling issues.
What percentage of your Google Ads budget is going to brand? The median across this sample is 33.9%.
Are you tracking leads per contractor by campaign type? The average contractor in this sample generated 148 unique leads from $8,418 in brand spend YTD -- and 72 unique leads from $17,212 in non-brand search spend. Volume per dollar is a useful gut check alongside CPL.
The data in this artic,e covers 28 roofing contractors on the SearchLight platform, January 1-June 12, 2026. All accounts anonymized. Campaign classification based on naming conventions. PMAX campaigns excluded due to minimal volume. ROAS figures reflect closed revenue; revenue potential ROAS includes pipeline not yet collected.
Jon Torrey Founder, Data-Driven Roofing Head of Marketing, SearchLight